

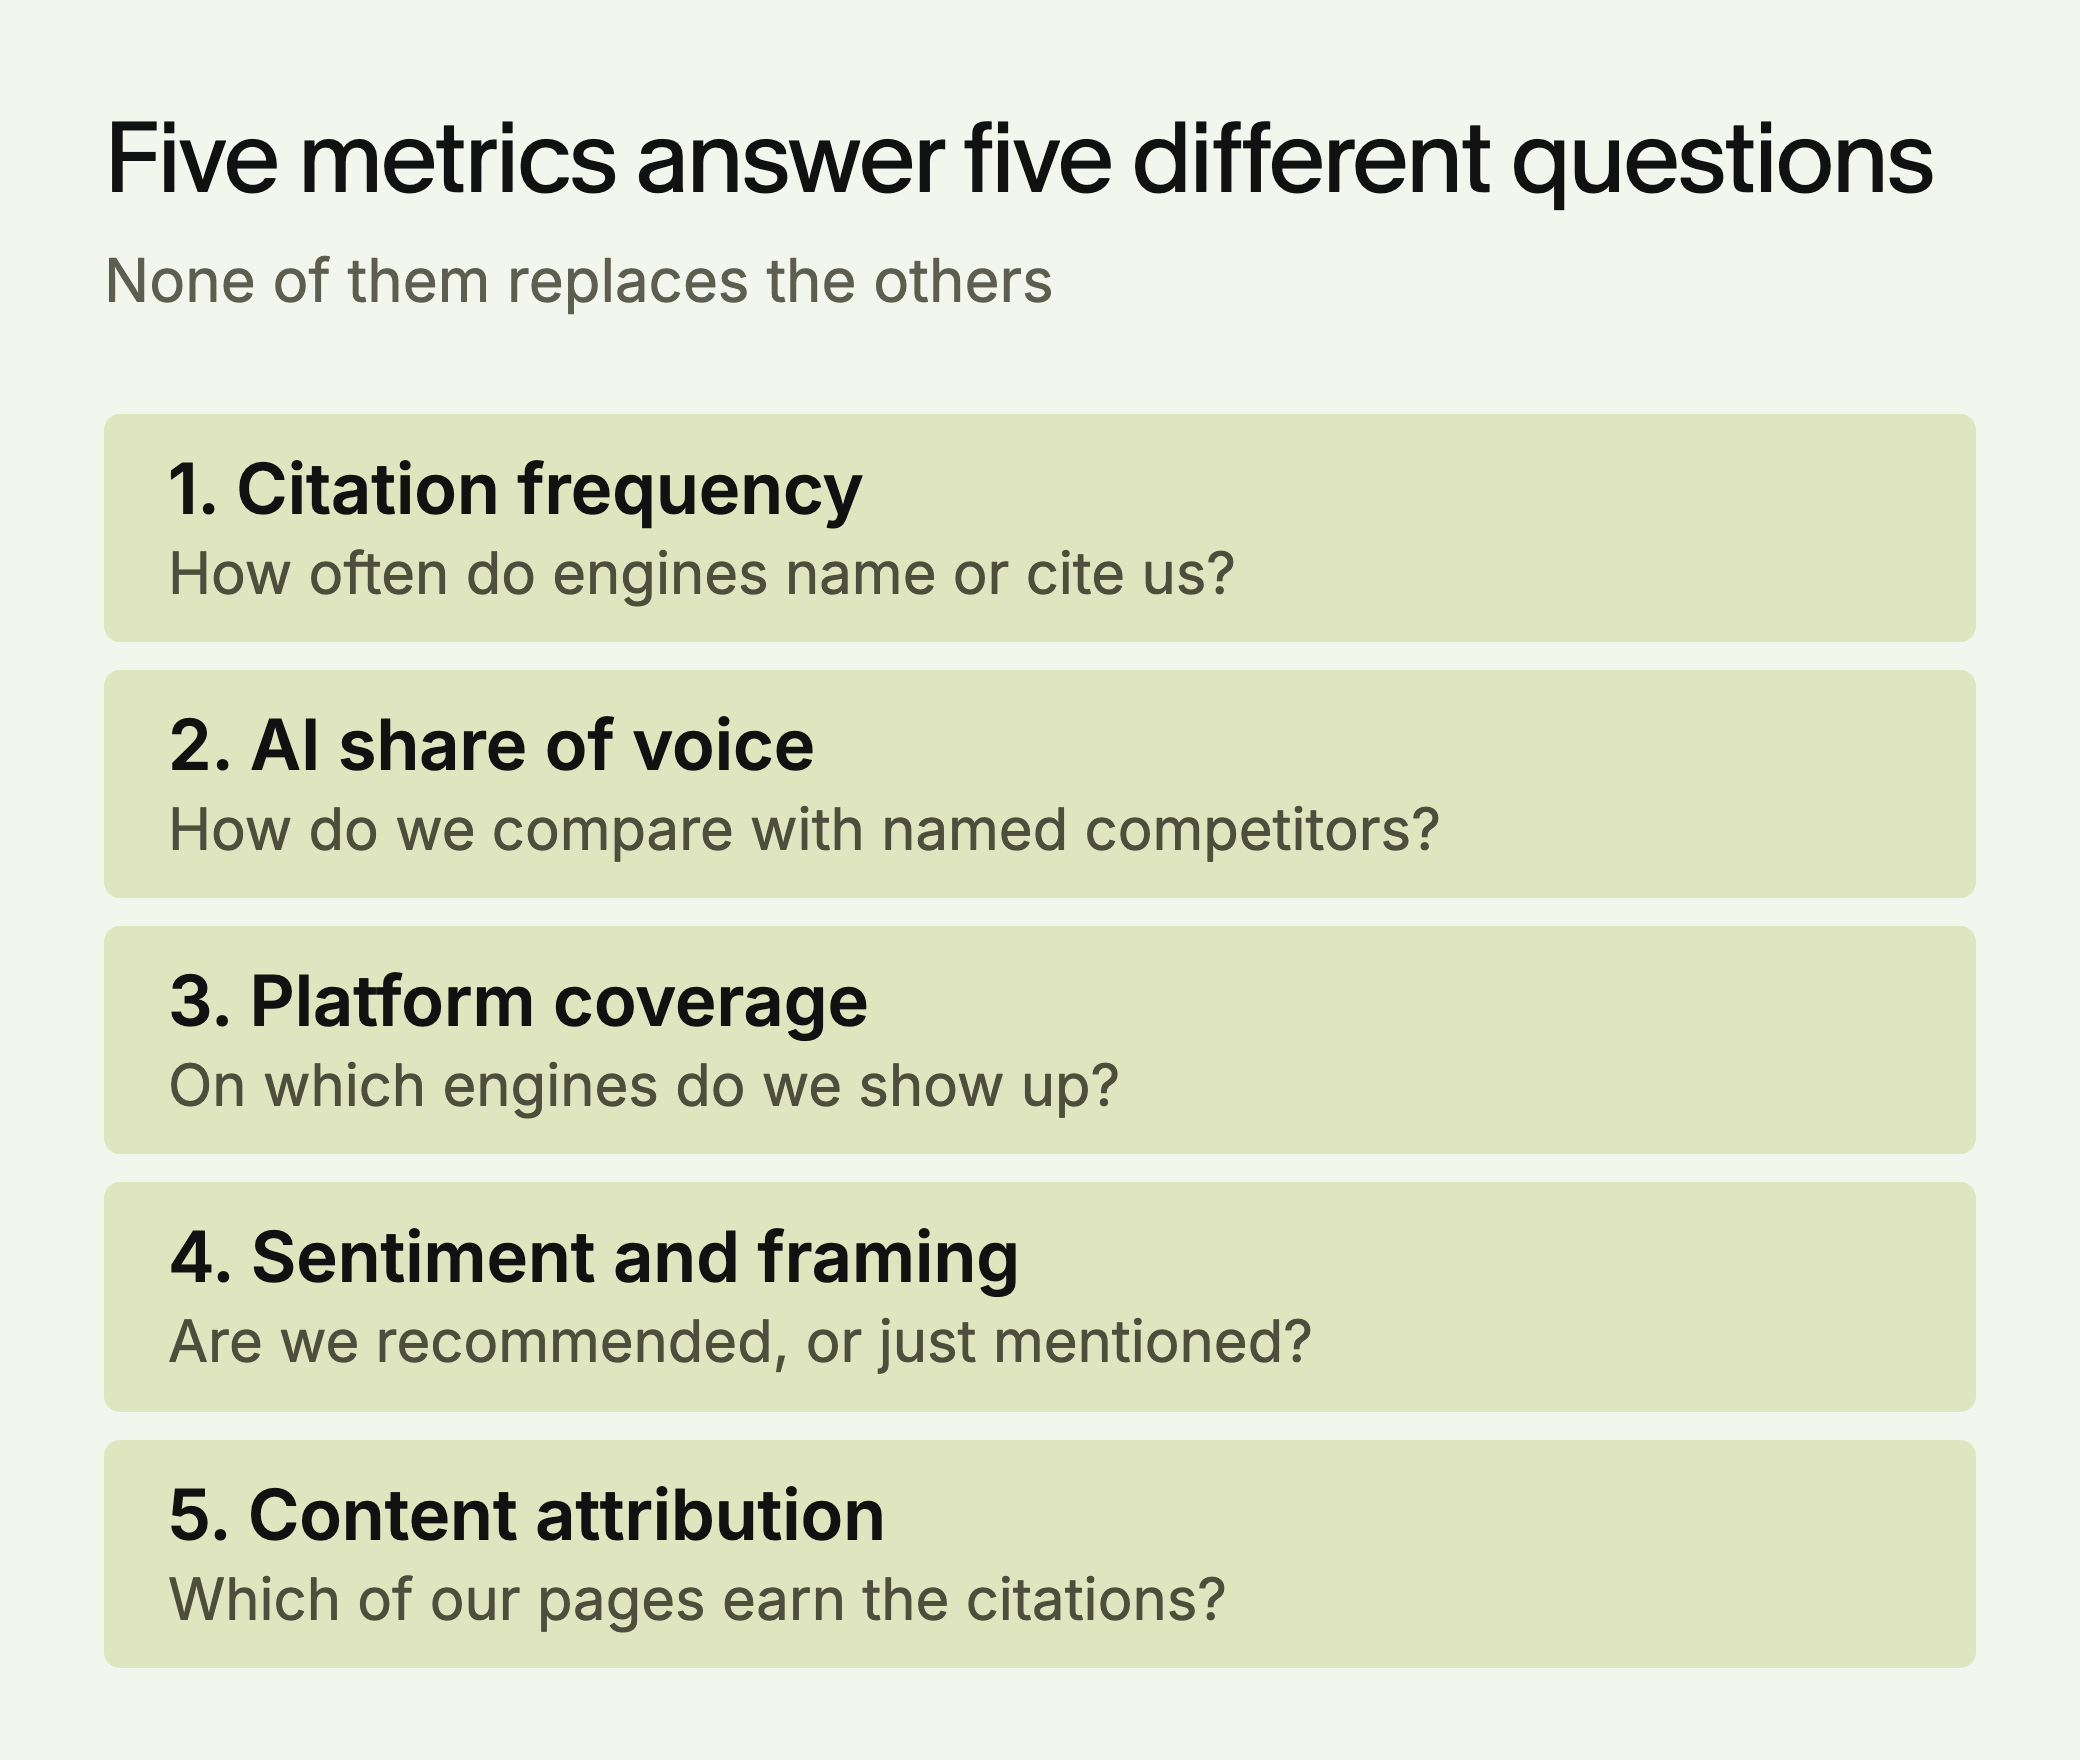
Measure GEO with five numbers: how often you appear, your share against competitors, your coverage across engines, how you are described, and which pages get cited. Run each prompt several times and compare against your own baseline, because AI answers vary from run to run. Analytics and rank trackers show only part of this.
Contents
- Why SEO Metrics Only Show Part of It
- Metric 1: Citation Frequency
- Metric 2: AI Share of Voice
- Metric 3: Platform Coverage Score
- Metric 4: Sentiment and Framing Score
- Metric 5: Content-to-Citation Attribution
- Building Your Baseline
- A Worked Example: One Baseline Round
- What Changes by Business Type
- A Measurement Cadence
- Common Mistakes
- Start This Week
- FAQ
Why SEO Metrics Only Show Part of It
Google Search Console now has generative AI performance reports, available to all sites since August 31, 2026. They show impressions in AI Overviews and AI Mode by page, country, device and date. They report impressions only, cover Google only, and don’t show whether your brand was named.
Read those reports with care. The chart counts two results from the same site in one AI feature as one impression, while the table by page counts by page, so the totals can differ. The newest data can be preliminary. The report may also not appear if a site hasn’t had enough impressions in these features, so small sites may have only prompt runs to go on.
Analytics tools see visits that arrive from an AI product. They can’t see the buyer who reads an answer and types your name later, or who never visits.
Be careful with claims about AI traffic value. Siege Media’s analysis of 78 sites (agency data, January to May 2026, first-party GA4) found a median AI-to-organic conversion ratio of 1.26x, and 1.05x for B2B SaaS. AI traffic was roughly 0.2% to 3% of sessions on most sites. Measure visibility because it shows how buyers meet your brand in answers, and test the revenue case on your own data.
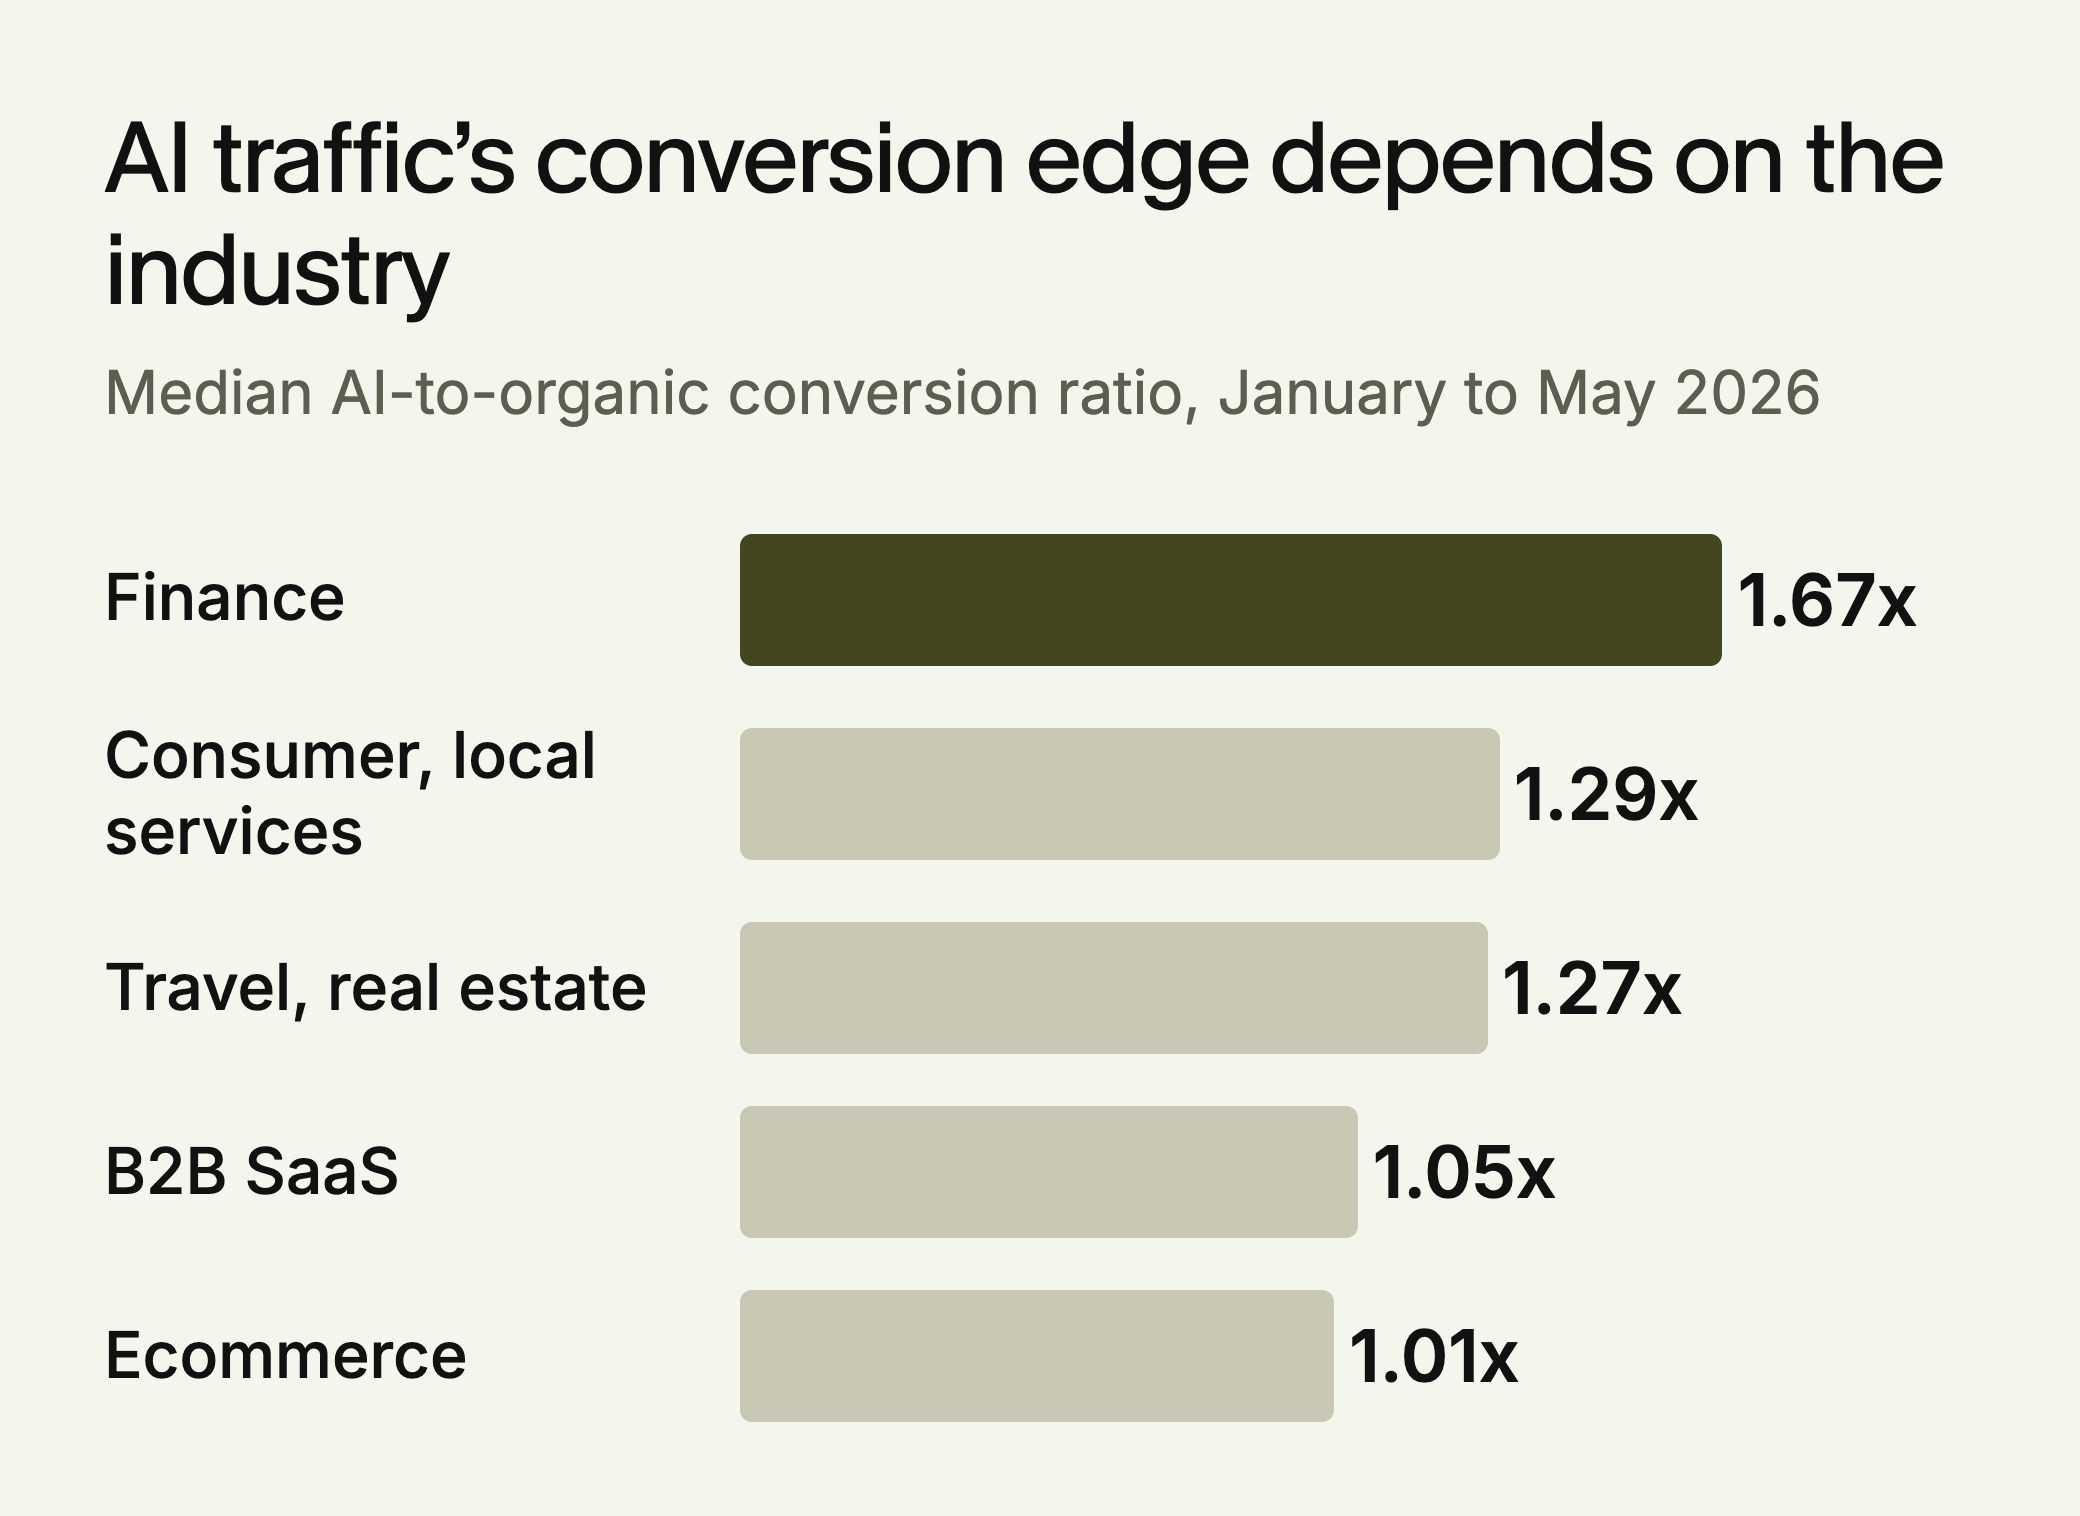
Siege Media also found AI matched or beat traditional conversion on 72% of sites, but out-earned it per session on fewer than half of the sites with reliable revenue tracking. A good conversion ratio and a good revenue story aren’t the same thing, so check both before quoting either to your CFO.
No single source shows the whole picture. Each of these answers a different part of the question.
| Source | What it sees | What it misses |
|---|---|---|
| Search Console AI reports | AI Overview and AI Mode impressions by page, country, device and date | Other engines, and whether you were named |
| Analytics | Visits and conversions from AI referrers | Readers who never click, or who search your name later |
| Bot logs | Which crawlers fetched which URLs | Whether anything was used in an answer |
| Prompt runs | Who gets named and cited, by engine | The exact wording your buyers use |
Metric 1: Citation Frequency
In a representative set of prompts, how often does AI name or cite you? Record mentions and linked citations separately, since an answer can name you without linking to you, or link to you without naming you.
How to calculate it:
- Build a set of 50 to 100 prompts: category questions, comparisons, problem-solving and feature questions.
- Run each one several times on your target engines: at minimum ChatGPT and Perplexity, ideally also Google AI Mode, Claude and Gemini.
- Count the responses that mention your brand, and those that cite your domain.
- Citation frequency = (responses citing you ÷ total responses) × 100.
Benchmarks: we found no reliable public benchmark for this metric. Compare yourself with your own baseline and your named competitors on the same prompts.
In a SparkToro study of 2,961 runs, there was less than a 1 in 100 chance of ChatGPT or Google AI giving the same brand list in any two of 100 runs. The authors recommend tracking how often a brand appears rather than its position, and running each prompt 60 to 100 times where you can. The study wasn’t peer-reviewed, and a tracking vendor took part.
Keep those two counts apart in your reporting. In AirOps’ vendor data, only about 28% of answers included brands that were both mentioned and cited, so the numbers often diverge.
How many runs is enough
A presence rate is a percentage, and every percentage from a sample has a margin of error.
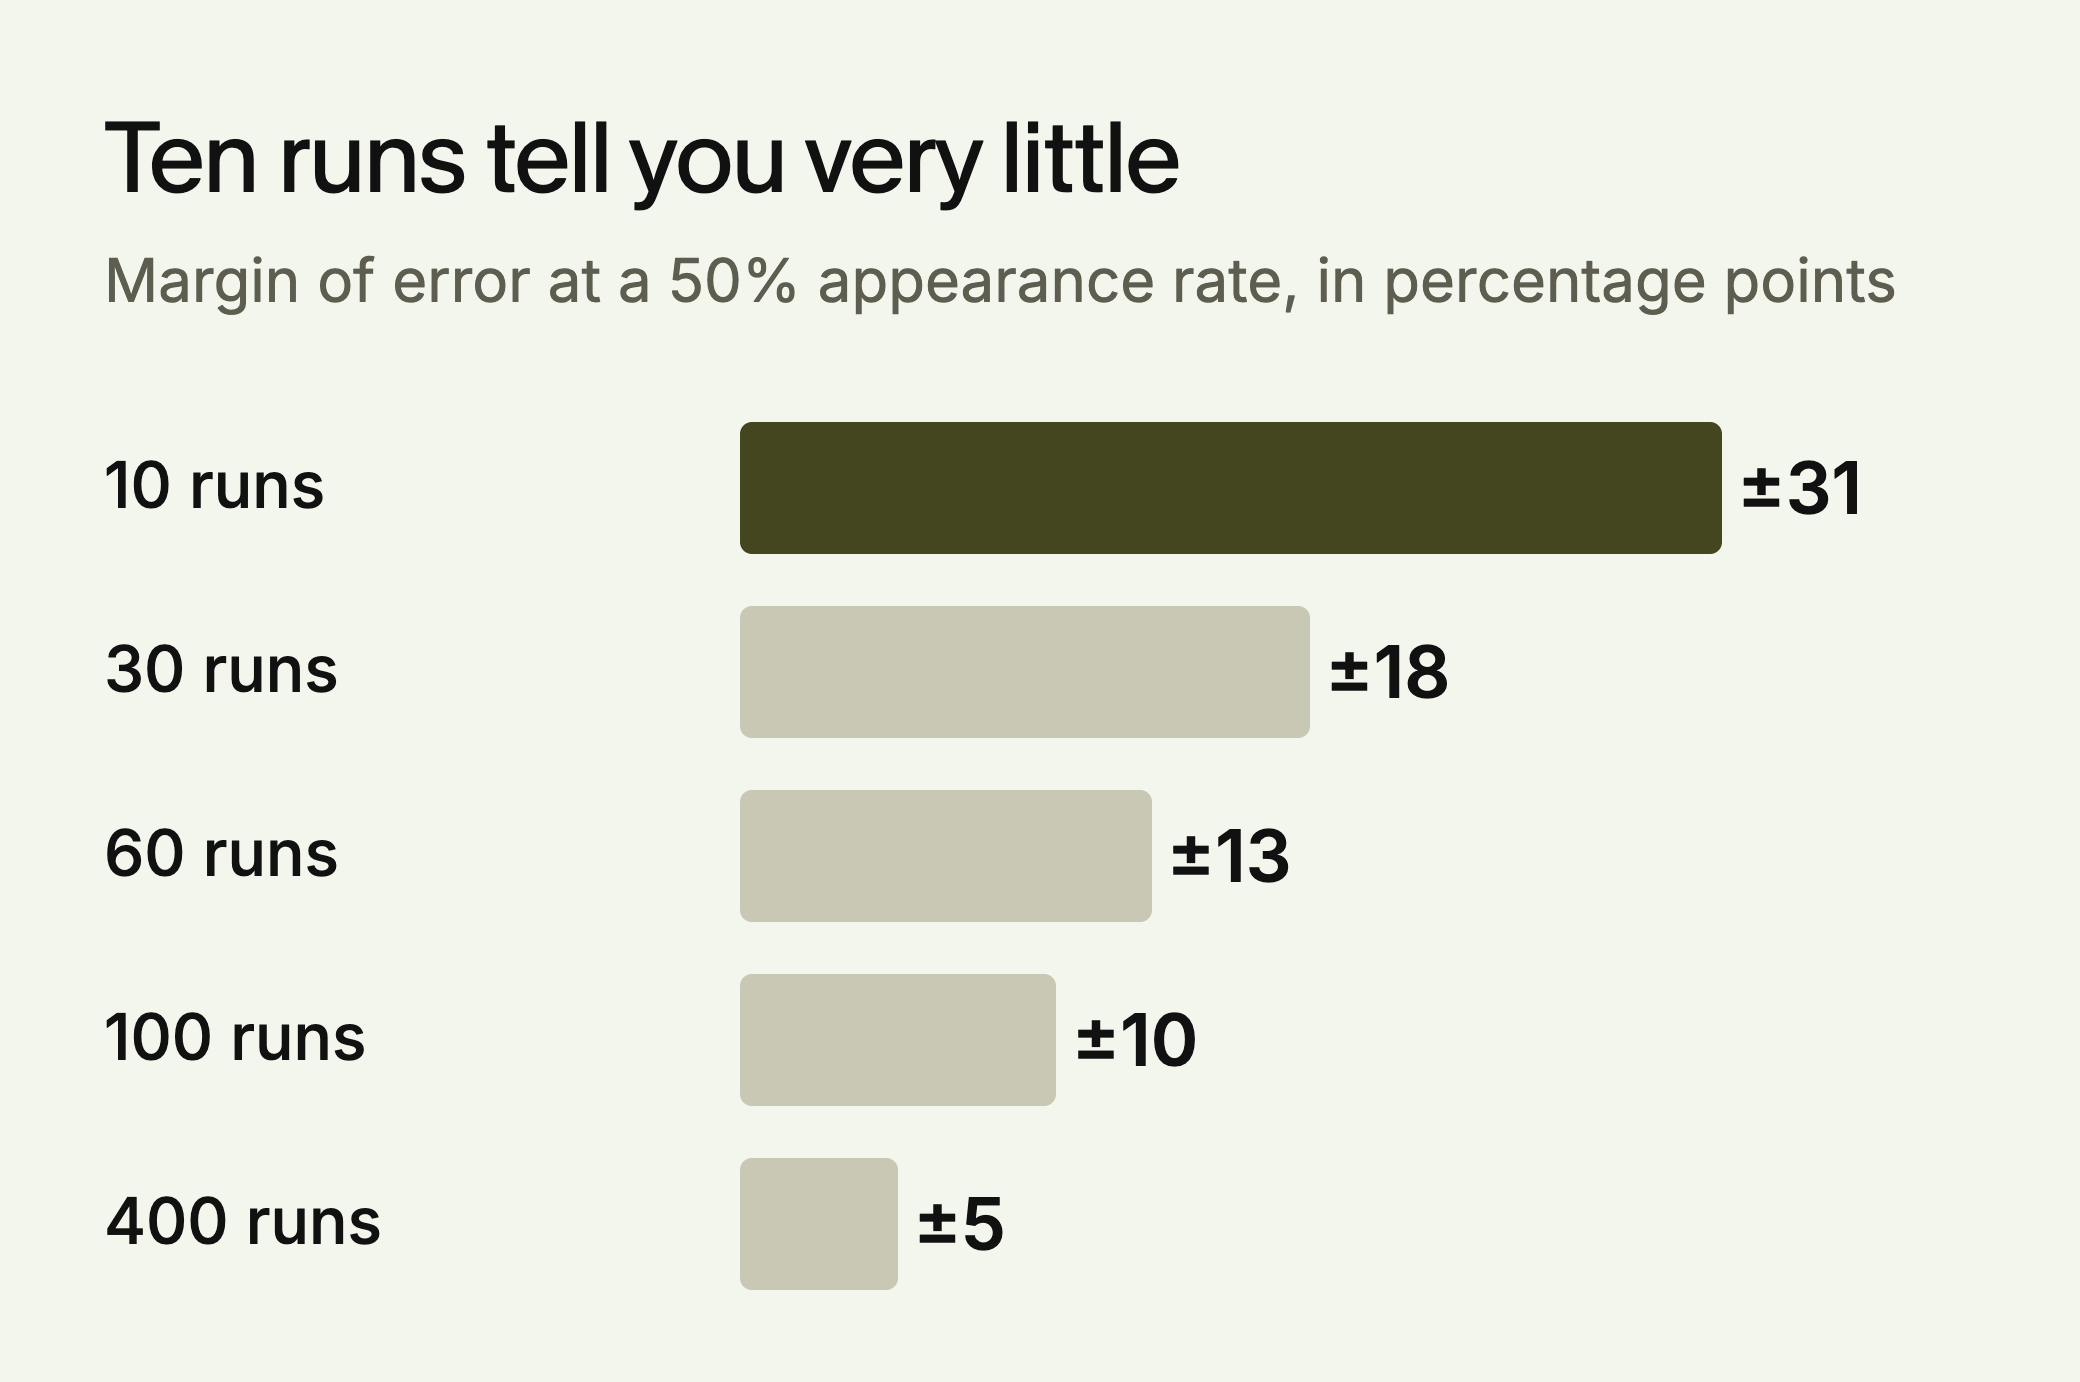
If your true rate is 50%, ten runs could plausibly show anything from about 19% to 81%. That is why SparkToro’s 60 to 100 runs per prompt is a sensible target, and why a handful of runs can’t support a claim about one prompt.
Few teams can afford that across every prompt. The practical compromise is to report the set as a whole. Fifty prompts on three engines at five runs each gives 750 responses, enough to track the overall rate even though no single prompt is well measured. Don’t draw conclusions from one prompt’s movement unless you’ve run it many times.
Prompt wording adds a second layer of uncertainty. Across 142 prompts that SparkToro’s volunteers wrote for the same need, the average semantic similarity was 0.081. Your list is a sample of how buyers ask, so write several phrasings of your important questions. Variation also depends on category: SparkToro saw far more consistency for SaaS cloud providers than for sci-fi novels.
Metric 2: AI Share of Voice
Citation frequency shows how often you appear. Share of voice shows how that compares with competitors. On the same prompt set, count mentions of each brand and calculate each brand’s percentage of all mentions.
If 200 responses produce 500 brand mentions and you have 75, your share of voice is 15%.
Fix the competitor list before you start, and run the metric before and after a major content or PR push so you can see any change.
Decide whether the denominator is your named competitors or every brand that appears, and don’t switch later. Counting only named competitors produces a higher share and hides new entrants. Log any unfamiliar brand that shows up repeatedly, and review the list each quarter.
Metric 3: Platform Coverage Score
Engines often cite different sources. Profound (vendor data, 100,000 prompts run on both engines, published July 2025) found 11% of cited domains appeared in both ChatGPT and Perplexity. A strong result on one engine tells you little about another.
How to calculate it: run the same 30 to 50 prompts across five engines and record citation frequency for each. Your score is the number of engines where you pass a threshold you set, divided by the number tested.
For example, with a 15% threshold, a brand above it on Perplexity only scores 1 out of 5. Choose the threshold from your own baseline and keep it fixed.
The score treats every engine equally. If one engine matters far more to your buyers, report it separately rather than adding weights you’ll struggle to defend.
Metric 4: Sentiment and Framing Score
Being named isn’t enough if you are named as the second choice or with a warning. In SparkToro’s data, one hospital appeared in 69 of 71 ChatGPT responses but was the top mention in only 25.
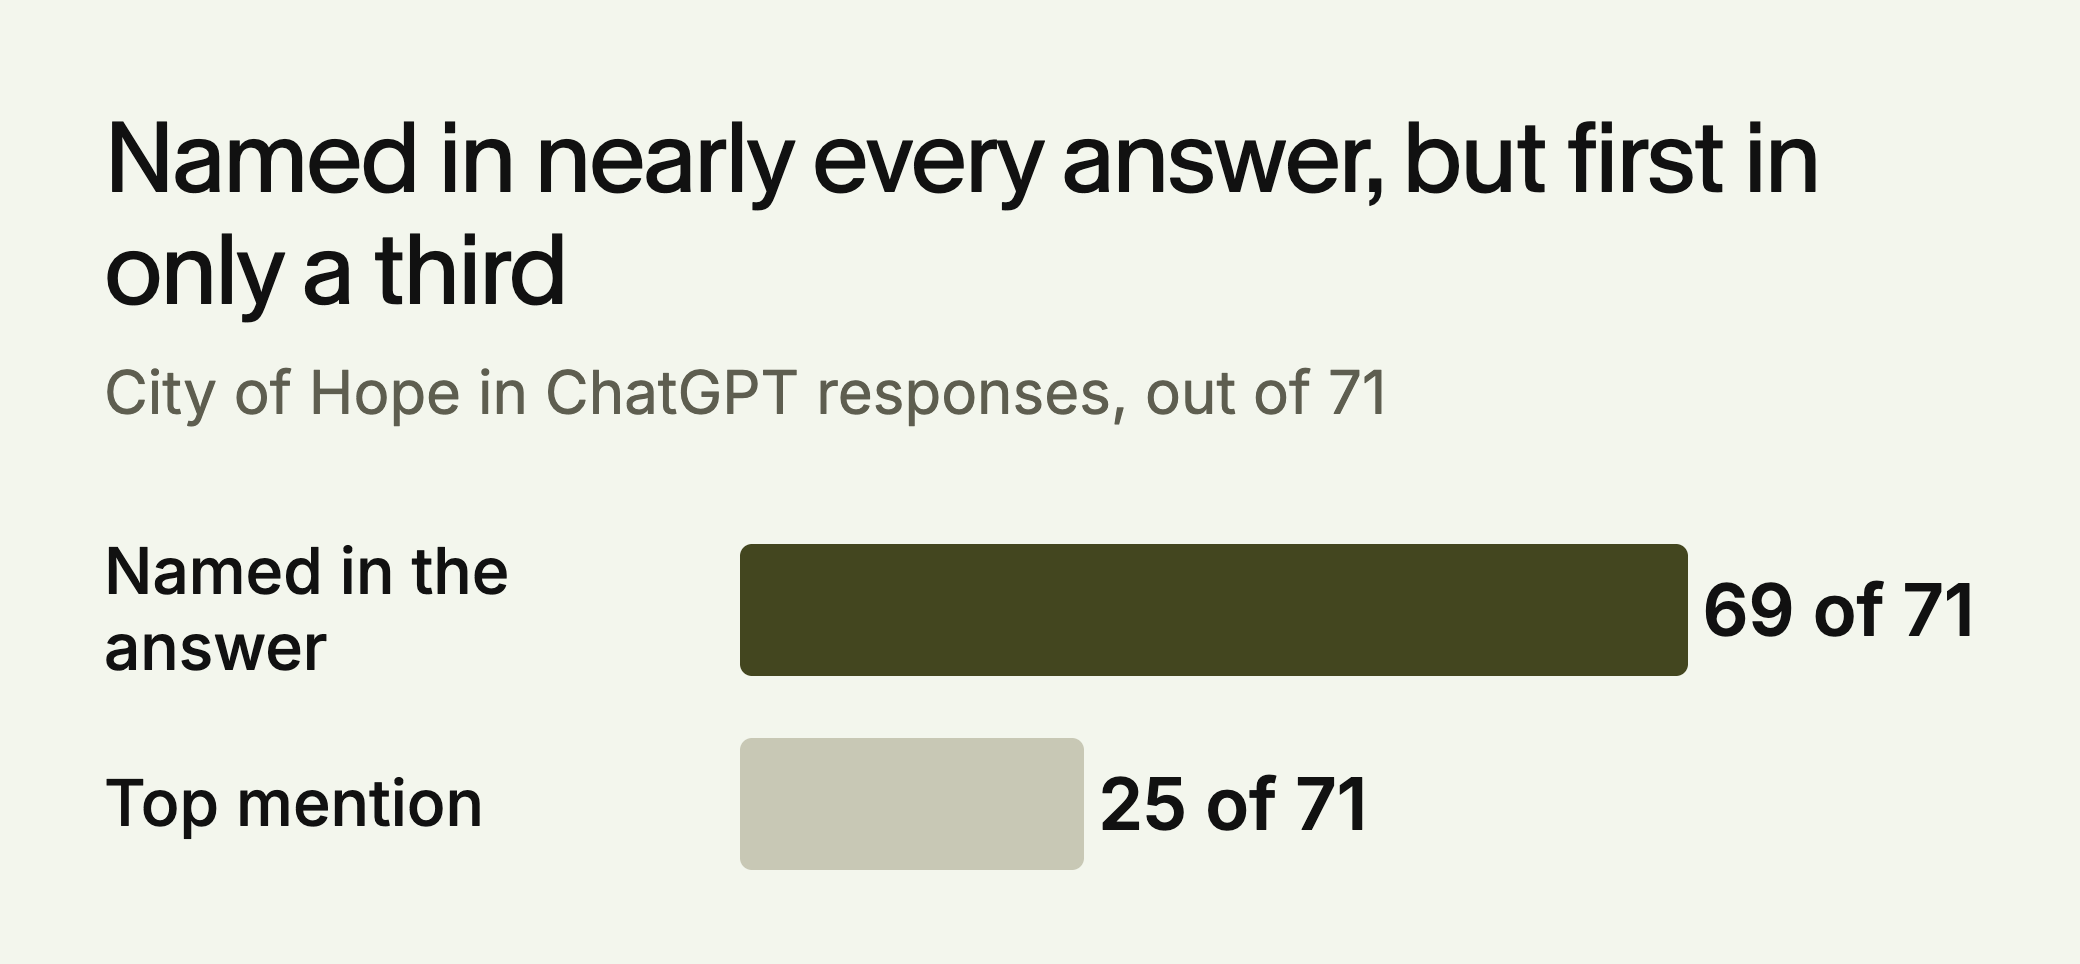
For each response that names you, label the mention as one of these: primary recommendation, secondary mention, neutral mention, or negative or qualified mention. Read a sample by hand, because comparative wording is easy to misclassify.
Track primary recommendation rate separately. High frequency with a low primary rate points to a positioning problem.
SparkToro also warns that position within an answer is unreliable, with identical order appearing about once in 1,000 runs. So read primary recommendation as a rate across many responses, and never as where you landed in one.
Metric 5: Content-to-Citation Attribution
This metric shows which of your pages earn citations. When a response cites your domain, record the exact URL. Then group the URLs by topic and format, and compare them with pages on the same topics that aren’t cited.
Use the links engines actually show. We wouldn’t treat a model’s account of where it got something as evidence, because the explanation is generated too.
For Google, the Pages view in Search Console’s generative AI report adds impressions by URL. Run this audit quarterly, and use it to decide what to update first.
Building Your Baseline
Without a baseline you can’t separate normal fluctuation from the effect of your work. A workable minimum:
- 50 prompts covering your category, use cases and competitors
- 3 engines: ChatGPT, Perplexity and Google AI Mode
- 3 competitors tracked alongside you
- Two rounds seven days apart, with several runs of each prompt per round
Calculate how much your own numbers move between the two rounds, and treat that as your noise level. Don’t borrow someone else’s figure. AirOps’ vendor data found only 30% of brands stay visible from one answer to the next and 20% across five runs, so a small change in a small sample may mean nothing.
A Worked Example: One Baseline Round
The company and figures below are made up for illustration. Quillon runs 50 prompts on three engines, four times each, for 600 responses, and tracks three competitors.
| Metric | Calculation | Result |
|---|---|---|
| Citation frequency | 84 responses cite Quillon, out of 600 | 14% |
| Mention rate | 132 responses name Quillon, out of 600 | 22% |
| Share of voice | 132 of 680 mentions (rivals have 240, 198 and 110) | 19.4% |
| Platform coverage | Citation frequency: ChatGPT 9%, Perplexity 21%, AI Mode 12%. Threshold 15% | 1 of 3 engines |
| Primary recommendation | 33 of the 132 responses that name Quillon | 25% |
| Attribution | 31 of 84 citations go to one comparison page | 37% |
Three actions follow. ChatGPT is the weakest engine, so Quillon compares the pages it cites there with its own. Being named first only a quarter of the time points to a positioning problem, so Quillon reads those answers to see who is preferred and why. One page carries 37% of citations, so keeping it current comes first.
None of this is meaningful until the second round shows how much these numbers move on their own.
What Changes by Business Type
| Business | Prompts to favor | What to watch |
|---|---|---|
| B2B SaaS | Comparisons, integrations and “best for” questions | Siege’s 1.05x is a weak case for direct conversion. Report visibility, and ask new leads how they found you |
| Ecommerce | Product, price and “best under” questions | At 1.01x, revenue per session matters more than the conversion ratio |
| Finance and other regulated fields | Eligibility, cost and risk questions | Read framing by hand, since a wrong description costs more than a missing one |
| Small sites | Start with 20 prompts on two engines | Search Console may not show AI data yet, so manual runs are the baseline |
These are our recommendations, apart from the Siege Media figures.
A Measurement Cadence
This schedule is a practical starting point, not a research finding:
- Weekly: citation frequency on your 20 to 30 most important prompts
- Monthly: the full prompt set across all engines, with share of voice and coverage
- Quarterly: attribution, sentiment and framing, and a review of the prompt set
Keep prompts fixed between reviews so the numbers stay comparable. Log any content or PR changes with their dates.
Common Mistakes
Editing the prompt set mid-series. Any new or reworded prompt breaks comparison with earlier rounds. Add prompts only at a quarterly review, and report old and new sets separately.
Blending engines into one score. A rise on Perplexity can hide a loss on ChatGPT.
Mixing collection methods. SparkToro’s authors call it an open question whether API calls match what real users see. Record whether you used the app or the API, and don’t switch between rounds.
Copying someone else’s benchmark. Published rates come from different prompts, categories and engines. A 20% citation rate could be excellent in one category and poor in another.
Reporting a percentage with no count. Write “14% (84 of 600)”, so a reader can see how much data sits behind it.
Start This Week
- Write your 50 prompts and name three competitors.
- Open Search Console’s generative AI report and export AI impressions by page.
- Run your first baseline round and repeat it in seven days.
LLMagnet measures AI visibility across seven engines and has an agent that prepares fixes for approval, so the prompt runs don’t have to stay manual. You can start with the free AI visibility audit.



 Ask Claude





 30-day free trial · no credit card